


GroundMapFusion™
Hobart · 3 surveys fused
Fusion packages
Scoped to your site. Combine as needed.
Start with a pilot on your own data under a written pilot agreement, before any paid engagement.
Request a proposal ↗
Fusion Multi-Pass
Extra passes at new headings and angles, cross-checked into one model.

Fusion Archive
Earlier surveys of the site, from any year or datum, aligned with your new capture.

Fusion Monitor
Repeat capture on your schedule. Real change, beyond each pair's measured scatter at 95 % confidence, kept as its own layer.
- FusionYour passes and earlier surveys, aligned and fused into one point cloud, every point graded by how many passes agree.
- Fusion GradedAdds a confidence class to every point and flags every modelled surface. Real change, beyond each pair's measured scatter at 95 % confidence, kept as its own layer.
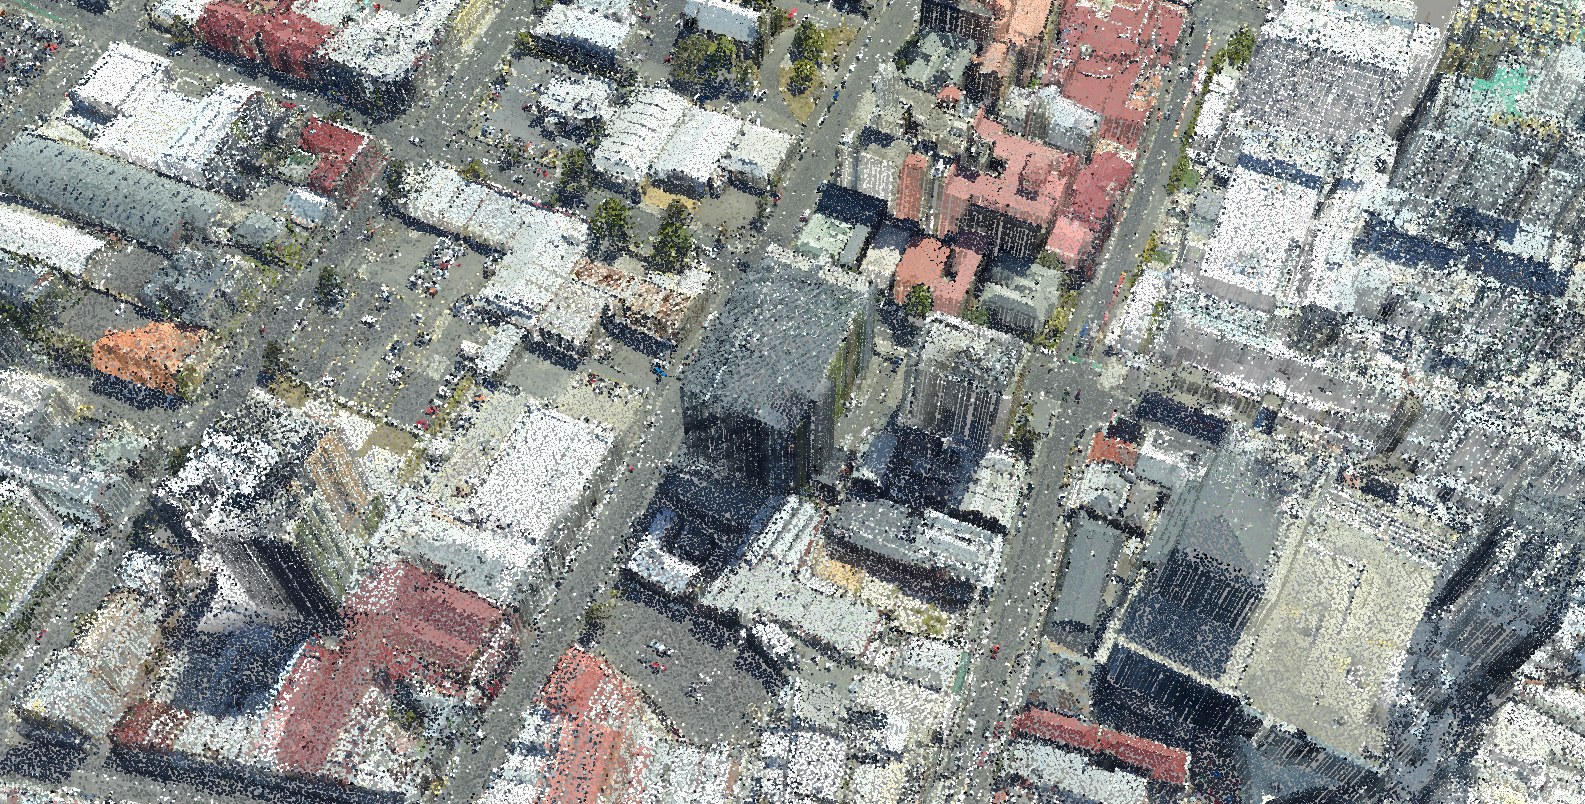
- Fusion SpectraLiDAR and imagery fused. Points measured from overlapping imagery join the laser-measured ones, each with its own confidence, and the colour comes from the photographs themselves.
Evidence classes: how each point is known
- Laser-measuredA LiDAR return. Graded by how many aligned passes agree on the surface.
- Image-measuredMeasured from overlapping images by photogrammetry and stereo, with its own confidence from the image geometry.
- ModelledA surface no pass measured, filled by geometric modelling. Flagged in every deliverable, never counted as measured.
- LearnedReserved: points from a trained model, if ever used, are flagged as learned, separately from modelled.
Every point graded
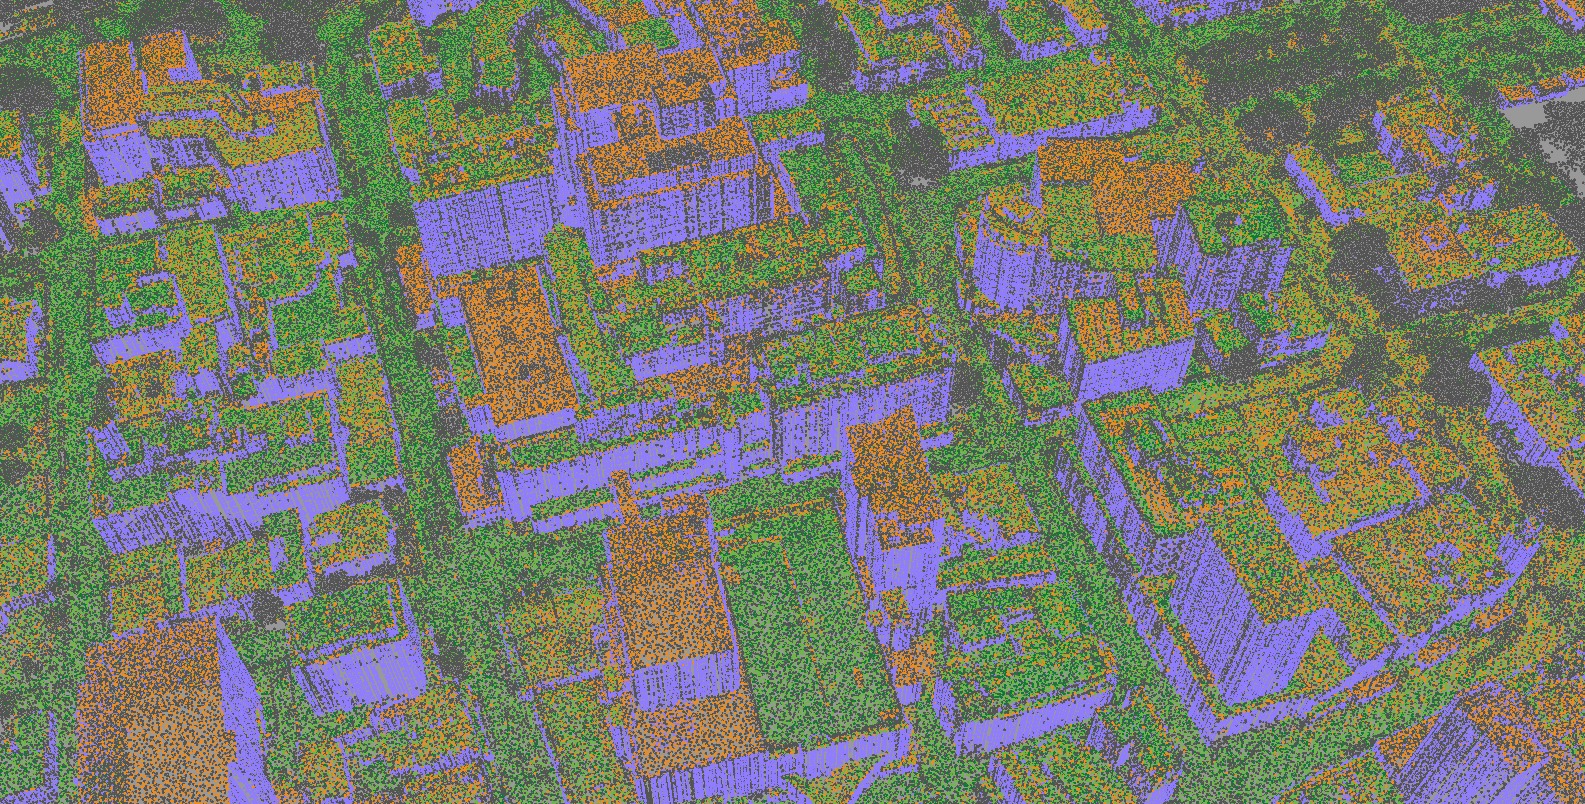
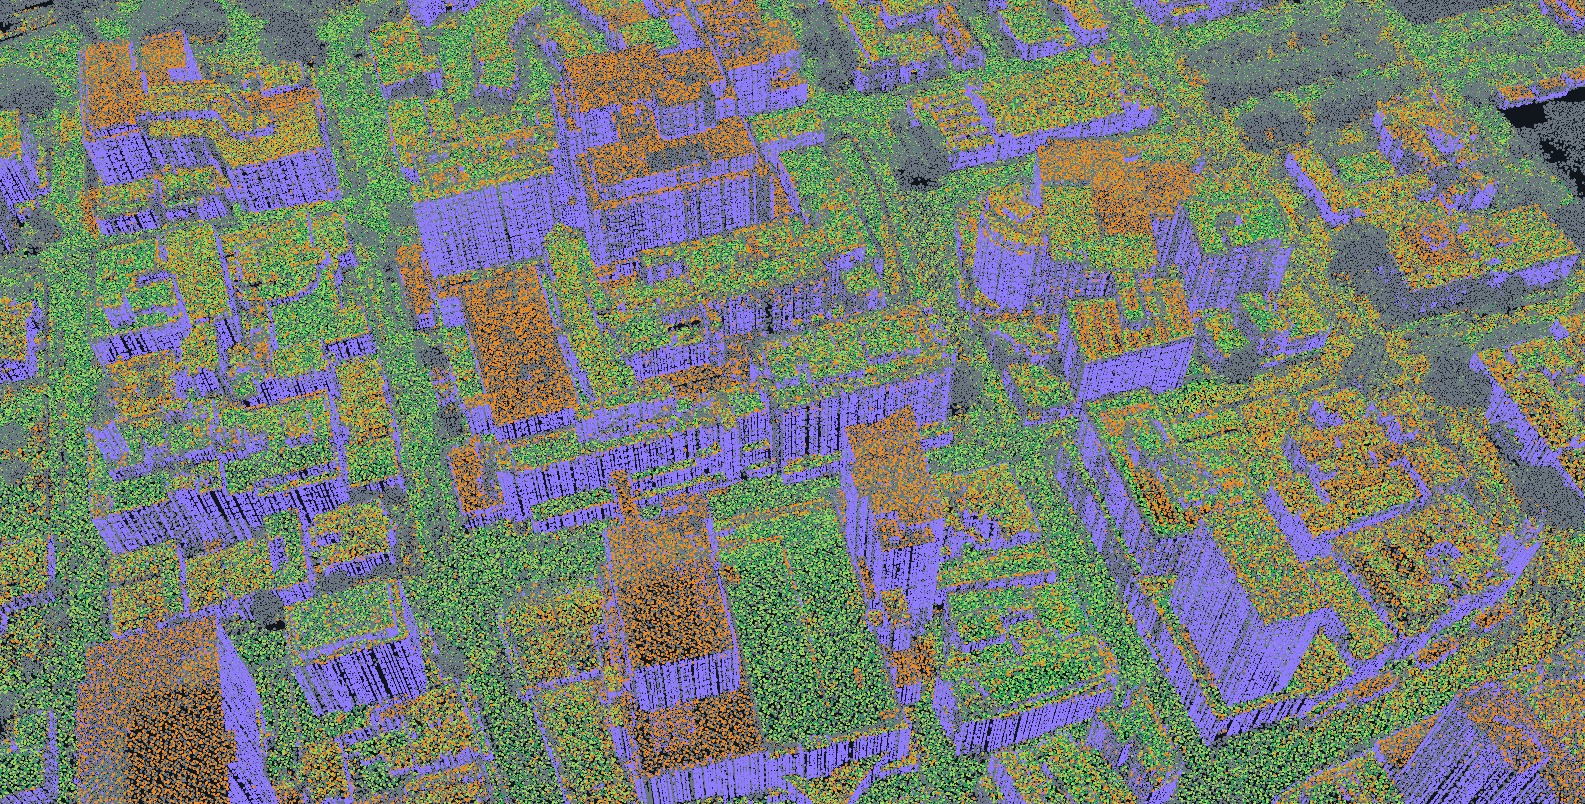
Whether two or more passes agree on the surface, point by point.


- 3 passes agreeThree aligned passes measure the same height, within 15 cm.
- 2 passes agreeTwo aligned passes measure the same height, within 15 cm.
- Single passMeasured, not cross-checked: one pass reached it, or it lies below the top surface.
- Change detectedPasses differ by more than 15 cm: real change, or disagreement between surveys.
- ModelledFilled where no pass measured. Hobart's walls: modelled from measured roof outlines, flagged. Never counted as confirmed.
Hobart: on stable open ground, checked independently of the alignment, the 2011 survey agrees with the 2024 survey to a median −6 mm (NMAD 64 mm, 95th percentile 157 mm; 94.4 % within 15 cm): relative agreement between surveys, not absolute accuracy. Accuracy
The evidence
Hobart: what each added survey contributes.
How it works
From surveys that disagree to a model you can defend.


- 01
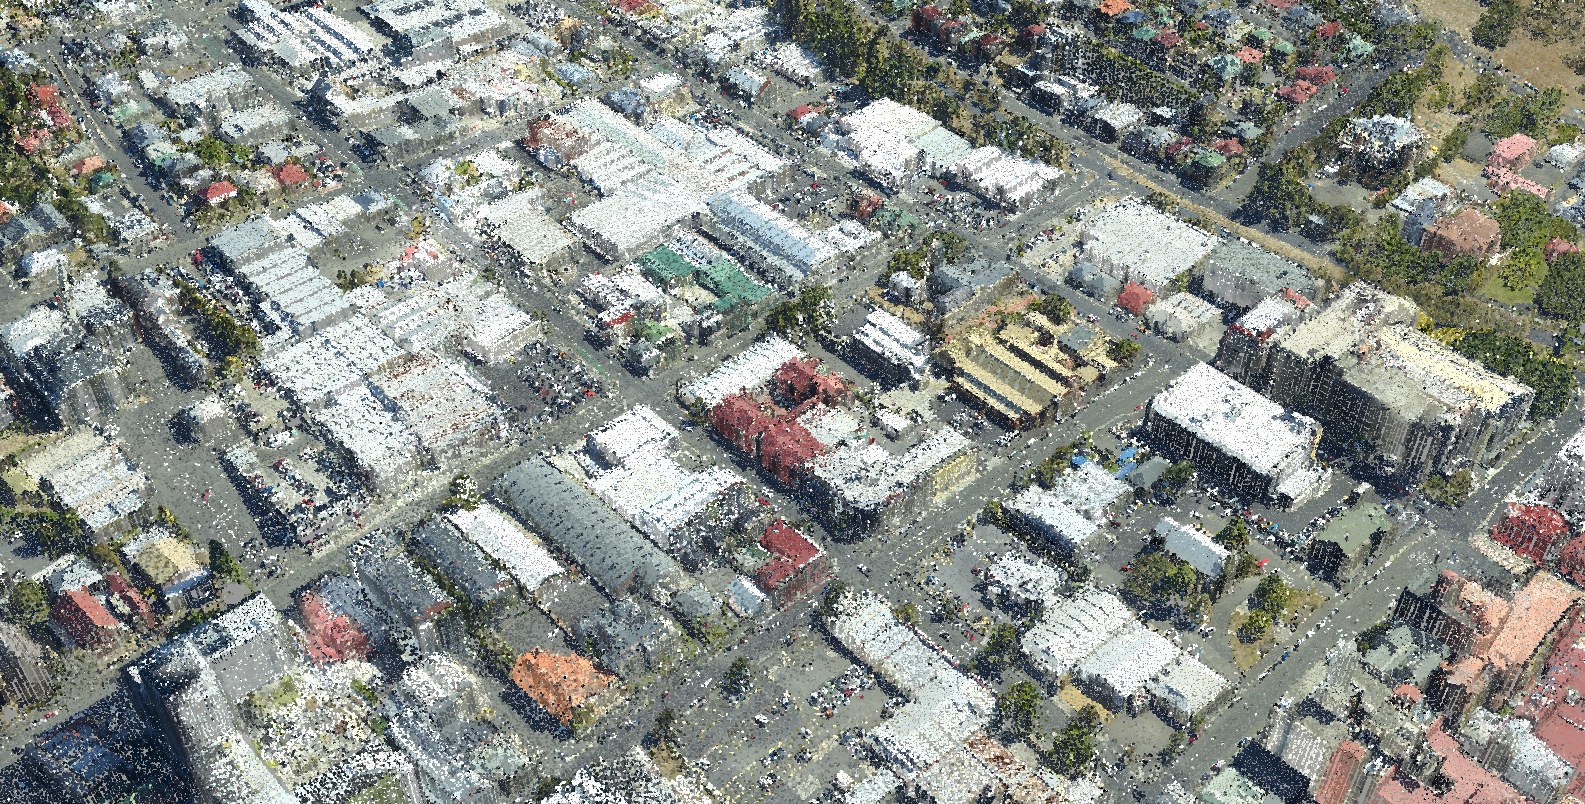
Align
Datum differences, offsets and distortions measured on unchanged ground, then removed from every pass.
Aligned · Hobart city centre - 02
Separate change
Real change, beyond each pair's measured scatter at 95 % confidence, kept as its own layer. Noise and moving objects removed.
Confidence · orange where passes disagree - 03
Fuse and grade
Passes merged into one point cloud; every point graded.
Fused · true colour - 04
Fill and flag
Modelling fills what no pass could see, such as walls, and flags every point.
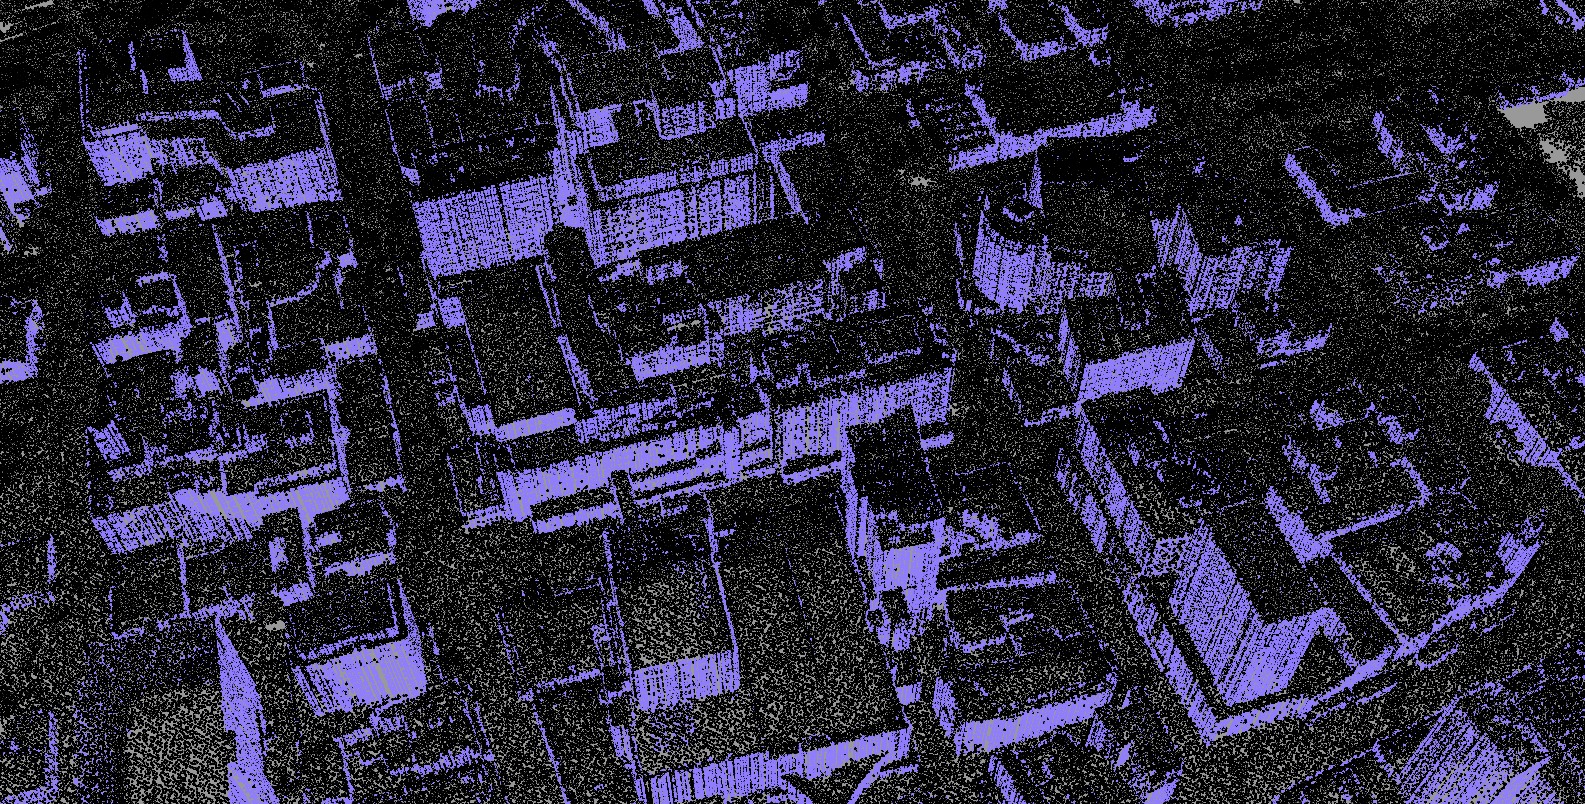
Hobart walls modelled from measured roof outlines, flagged · violet
Deliverables
| Inputs | New multi-pass capture, earlier surveys from any year or provider, and your own data. |
|---|---|
| Reference systems | GDA2020 / MGA coordinates, with heights on the Australian Height Datum, or as your project requires. |
| Point cloud | LAS 1.4 / LAZ with ASPRS classes, and confidence, source pass and agreement per point. Modelled points flagged; change between surveys as class 22, Temporal Exclusion (ICSM v2.0). |
| Rasters | Fused DTM and DSM (GeoTIFF / COG), with coverage, agreement and confidence rasters and a modelled-area mask. |
| Accuracy | Vertical accuracy against independent survey control; agreement between passes on every point. How accuracy is measured ↗ |
| Documentation | Processing lineage, per-pass co-registration, QA report, ISO 19115 metadata and a 3D web view. |
Showcase: GroundMap processing of public survey data, not client work. Survey data: Hobart City 2023/24 (captured by Fugro for the State of Tasmania; theLIST; CC BY 3.0 AU), Climate Futures Derwent 2008 (captured by DiMAP for ACE CRC; ACE CRC licence) and Mount Wellington 2011 (no licence on record), via ELVIS. Processing: GroundMap. Data and licences ↗
Downloads
Specification, method and a worked QA example.
- GroundMap Fusion spec sheetPDF · 1.4 MB
- Fusion methodologyPDF · 1.8 MB
- QA report, worked examplePDF · 3.1 MB
- Request sample data On request · a sample tile or your own area
FAQ
Why fly angled passes?
Passes that look straight down measure roofs and ground but rarely walls, so walls end up modelled. Angled passes measure them.
Why not just use the newest survey?
One survey misses what it could not see: ground under canopy, walls, shadowed slopes. It has no history either. Extra passes and earlier surveys fill both, once they agree.
Are modelled surfaces used in measurements?
Only if you choose. Modelled points carry the LAS synthetic flag, so any software can exclude them. Measured-only outputs are the default.